The idea: one function, a whole family of surfaces
A function of two variables has a graph z = f(x, y), a surface you can draw. A function of three variables, such as
f(x, y, z) = x2 + y2 − z2
would need four dimensions for its graph. So we draw its level surfaces instead: all points where f has one value k,
x2 + y2 − z2 = k
This is the 3D version of the level curves of a contour map. Each k gives one surface, and the page shows how that surface changes as k slides.
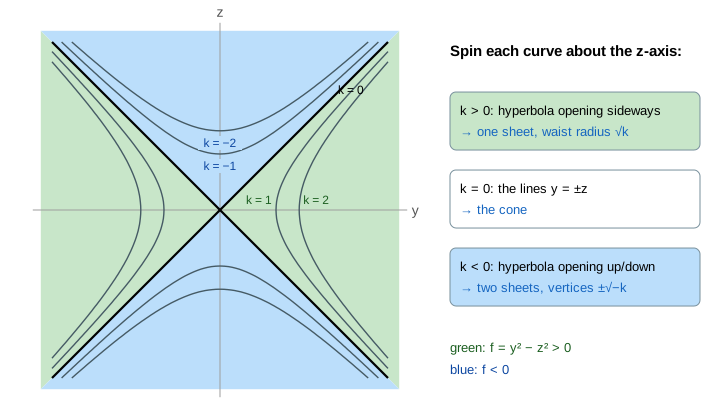
Because f only uses x2 + y2 = r2, every level is round about the z-axis: take the curve r2 − z2 = k in the plane x = 0 and spin it. That curve is drawn in the panel "the cut x = 0" on the canvas, over the grey levels k = −2, −1, 0, 1, 2.
Three shapes, one family
| k | level surface | nearest the origin | cut z = 0 |
|---|---|---|---|
| k > 0 | hyperboloid of one sheet | waist circle, radius √k | circle x2 + y2 = k |
| k = 0 | cone | the apex (0, 0, 0) | one point |
| k < 0 | hyperboloid of two sheets | vertices (0, 0, ±√−k) | empty |
Start at k = 1: a one-sheet hyperboloid with a waist of radius 1. Lower k and the waist shrinks (radius √k). At k = 0 it is a single point and the surface is the cone x2 + y2 = z2. Go below 0 and the cone tears at the apex: two sheets appear, with a gap |z| < √−k between them that grows as k falls. (Demo 1: slide k from 2 to −2, Demo 2: k = 0: the waist pinches to a point, then tears)
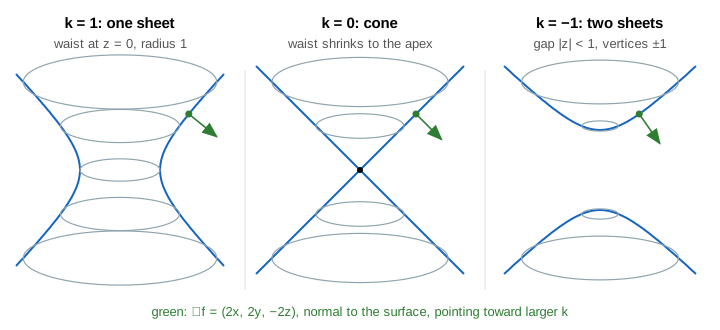
Far from the origin all three look alike: they hug the same cone, drawn in grey on the canvas. That cone is the asymptotic cone of both hyperboloids, just as the lines y = ±z are the asymptotes of every hyperbola in the contour map.
Every point lies on exactly one level
Pick any point P. It has one value f(P), so it lies on the level k = f(P) and on no other. For example P = (1, 1, 0.5) gives 1 + 1 − 0.25 = 1.75 (one sheet), P = (1, 0, 1) gives 0 (on the cone), and P = (0, 0.5, 1.5) gives 0.25 − 2.25 = −2 (two sheets). Two different levels never meet, and together they fill all of space, like the layers of an onion. (Demo 3: every point lies on exactly one level)
The gradient is normal and points to larger k
The gradient of f is
∇f = (2x, 2y, −2z)
Along a level surface f does not change, so ∇f is perpendicular to it: ∇f is the normal vector, and the tangent plane at a point (x0, y0, z0) is x0x + y0y − z0z = k. The arrow also points the way f grows: from a two-sheet level toward the cone, and from the cone toward the one-sheet levels. On the canvas the green arrows keep pointing that way while k changes. (Demo 4: ∇f is normal and points to larger k)
∇f is zero only at the origin. The origin is on the level k = 0, so the cone is the one level with a singular point, the apex, where there is no tangent plane. Every other level is a smooth surface.
Other functions, the same story
| f(x, y, z) | levels f = k |
|---|---|
| x2 + y2 + z2 | spheres (k > 0), a point (k = 0), nothing (k < 0) |
| x2/a2 + y2/b2 − z2/c2 | the same three shapes, stretched: elliptic waist, elliptic cone |
| −x2 − y2 + z2 | the same family with the roles of k > 0 and k < 0 swapped |
| x2 + y2 − z | paraboloids z = x2 + y2 − k, all the same shape, shifted |
The general rule: the levels of a quadratic form change type only when k passes through the value at a critical point. Here that value is f(0, 0, 0) = 0.
The nine shapes side by side, with a k-slider of their own, are on Quadric Surfaces; spinning a curve about an axis is on Surfaces of Revolution.
What the page leaves out
Unequal stretches a, b, c (the levels then have elliptic waists), the straight lines on the one-sheet hyperboloid, tilted cuts of the cone, level surfaces of non-quadratic functions, and how a computer draws a level surface from samples (marching cubes).
See where this page fits on the Quadric Surfaces mind map.