The idea: one rule moves every point
Start with a graph you know, y = f(x), and change the formula a little. Four numbers cover the usual changes:
y = a · f( b·(x − h) ) + kWith a = 1, b = 1, h = 0, k = 0 it is f itself. Any other values move every point of the graph by the same rule: the point (x, y) on f goes to (x/b + h, a·y + k). So you never need to redraw the curve from scratch: move a few key points (a vertex, a corner, a peak) and draw the same shape through them. On the canvas the grey curve is f, the blue curve is the new graph, and the orange dots A–E are the key points.
Outside f and inside f
The numbers outside f, a and k, act on the output y and do what they look like. The numbers inside, b and h, act on the input x and do the opposite of what they look like.
| number | where | what happens to each point | example |
|---|---|---|---|
| k | outside, added | moves up by k | x² + 1: up 1 |
| a | outside, multiplied | y becomes a·y: vertical stretch by a | 2x²: twice as tall |
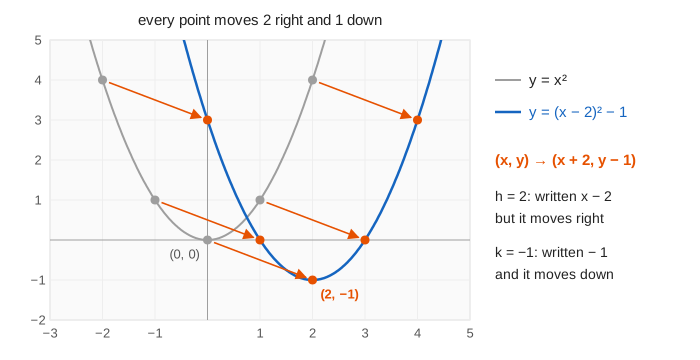
| h | inside, subtracted | moves right by h | (x − 2)²: right 2 |
| b | inside, multiplied | x becomes x/b: horizontal compress by b | sin(2x): half as wide |
In the canvas's parameter boxes these are written "y × a", "x ÷ b", "right h" and "up k". (Demo 1: move x² to vertex (2, −1))
Why the inside sign looks backwards
Take g(x) = f(x − 2). The point of f at x = 0, f(0), shows up in g where x − 2 = 0, that is at x = 2. Every input needs 2 more to reach the same value, so the whole graph sits 2 further right, even though the formula says minus. The same thinking explains b: g(x) = f(2x) reaches f(1) already at x = ½, so the graph is compressed to half its width. sin(2x) completes a full wave in π instead of 2π. (Demo 3: compress sin x)
Reflections
A negative factor reflects. a = −1 turns every y into −y: the graph flips across the x-axis, so −|x| is a V pointing down. b = −1 turns every x into −x: the graph flips across the y-axis, so √(−x) lives on the left. a = −2 is a reflection and a stretch at once: −2|x| + 3 is a downward V twice as steep with its top at (0, 3). (Demo 2: reflect and stretch |x|)
For an odd function like x³ the two reflections give the same graph: (−x)³ = −x³, so flipping across the y-axis looks exactly like flipping across the x-axis. For an even function like x² or |x|, flipping across the y-axis changes nothing at all.
The order of the steps matters
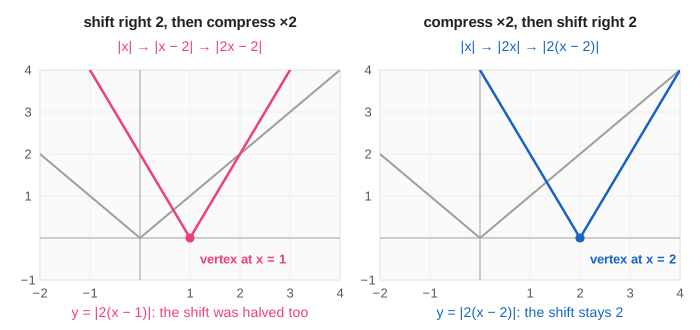
The page applies each step to the graph as it is now. A shift is not affected by what comes after it, but a stretch is applied to everything so far, including earlier shifts. Shift |x| right 2 and the vertex is at 2; compress by 2 and every x is halved, the vertex too, so it ends at 1: y = |2(x − 1)|. Compress first and shift second and the vertex stays at 2: y = |2(x − 2)|. In the parameters: a horizontal compress by c sets b → b·c and h → h/c; a vertical stretch by c sets a → a·c and k → k·c. (Demo 5: order matters)
Reading a·f(b(x − h)) + k as steps
To draw a given formula, read it in this order and every number does exactly what it says:
- horizontal stretch or compress by b (reflect in the y-axis if b < 0),
- shift right by h,
- vertical stretch by a (reflect in the x-axis if a < 0),
- shift up by k.
For y = −√(½(x + 3)) + 2 on √x: stretch horizontally by 2, shift left 3, reflect, shift up 2. The key point (4, 2) goes to (8, 2), (5, 2), (5, −2) and finally (5, 0). (Demo 4: all four on √x) Note that b(x − h) is not the same as bx − h: in sin(2x − π) the shift is π/2, not π, because sin(2x − π) = sin(2(x − π/2)).
The cubic x³ has no vertex; its key point is the centre (0, 0), where it changes from bending down to bending up. y = ½(x − 1)³ + 2 is x³ flattened by ½, moved right 1 and up 2, so the centre lands on (1, 2). (Demo 6: move x³'s centre to (1, 2))
Where it is used
- Vertex form of a parabola, y = a(x − h)² + k, is exactly this with f(x) = x²: the vertex is (h, k). See Quadratic Functions; for the standard form ax² + bx + c, see What a, b and c Do to a Parabola.
- Waves: y = A·sin(ω(t − t₀)) + c has amplitude A, period 2π/ω, phase shift t₀ and offset c.
- Graphics: translating and scaling a shape is the same idea applied to points in the plane. See Rotate and Scale 2D.
- Asymptotes move with the graph: 1/(x − 2) + 3 has asymptotes x = 2 and y = 3. See Types of Asymptotes.
What the page leaves out
Other base functions (1/x, 2ˣ, log x), transformations that are not of this form (rotations, shears, f(|x|), |f(x)|), inverse functions as a reflection across y = x, and how these moves combine as matrices; see Linear Transformations for that last one.