The idea: two numbers, two jobs
A linear function in slope-intercept form is
y = mx + bIts graph is a straight line. The two numbers each have one job: m is the slope, how much y changes for each step of 1 in x, and b is the y-intercept, where the line crosses the y-axis. On the canvas m is blue and b is green.
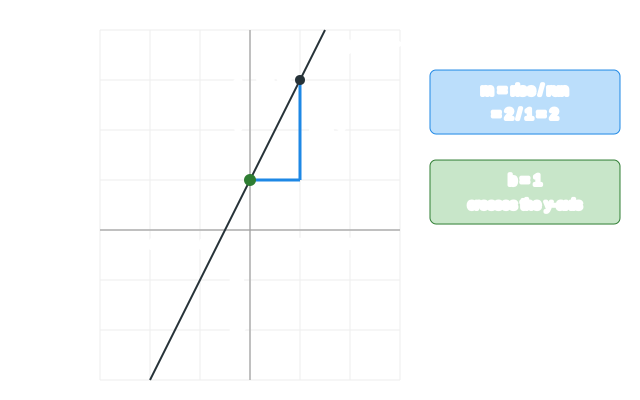
m: rise over run
Pick any point on the line, go some distance to the right (the run), then up or down until you are back on the line (the rise). The slope is
m = rise / runOn y = 2x − 3, a run of 1 needs a rise of 2, a run of 2 a rise of 4, a run of 4 a rise of 8. The ratio is always 2. That is what makes the graph straight: the steepness is the same everywhere. (Demo 1: rise over run)
| m | the line |
|---|---|
| 3 | rises steeply: up 3 for every 1 right |
| 1 | rises at 45°, like y = x |
| ½ | rises gently: up 1 for every 2 right |
| 0 | flat: a horizontal line y = b |
| −½ | falls gently: down 1 for every 2 right |
| −2 | falls steeply |
The sign of m says the direction (read left to right) and |m| says how steep it is. A negative rise is a drop: on y = −½x + 3 a run of 2 has a rise of −1. (Demo 5: a falling line)
b: the y-intercept
Put x = 0 into mx + b and only b is left, so the line always crosses the y-axis at (0, b). In a real problem b is the starting value: a taxi fare of 3 + 2 per km is y = 2x + 3, and the meter shows 3 before you move.
Changing m vs changing b
Changing b adds the same amount to every y, so the whole line slides straight up or down. The slope does not change, and lines with the same slope are parallel. (Demo 2: b slides the line)
Changing m leaves (0, b) where it is, because the m·x term is 0 at x = 0. Every line with the same b passes through that point, so a new m turns the line about it. (Demo 3: m turns the line)
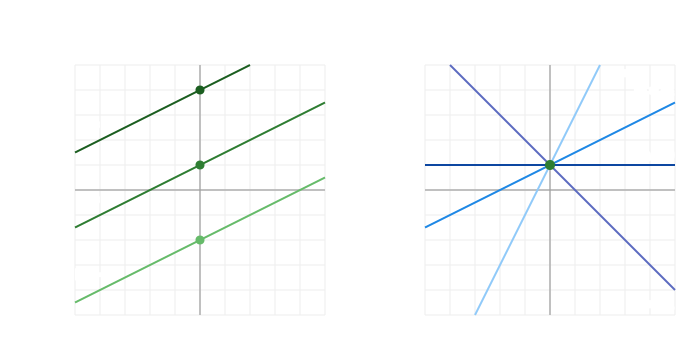
| change | stays the same | what moves |
|---|---|---|
| b | the slope, the direction | every point, up or down by the same amount |
| m | the point (0, b) | the steepness and the x-intercept |
The line through two points
Two points P1 = (x₁, y₁) and P2 = (x₂, y₂) fix exactly one line. The run and rise from P1 to P2 give the slope, then P1 gives b:
m = (y₂ − y₁) / (x₂ − x₁)
b = y₁ − m·x₁
For P1 = (−2, −1) and P2 = (2, 5): run = 2 − (−2) = 4, rise = 5 − (−1) = 6, m = 6/4 = 1.5, and b = −1 − 1.5·(−2) = 2, so the line is y = 1.5x + 2. Swapping the two points flips the sign of both the rise and the run, so m comes out the same. (Demo 4: the line through two points)
The same facts also give the point-slope form y − y₁ = m(x − x₁), which is handy when you know a point but not b. Expanding it gives back y = mx + b.
Horizontal and vertical lines
A horizontal line has rise 0 for every run, so m = 0 and the function is y = b. A vertical line has run 0 for every rise, and rise / 0 has no value: its slope is undefined. Its equation is x = c. It is not a function of x, because one x has many y, so it cannot be written as y = mx + b. (Demo 6: a vertical line has no slope)
The x-intercept
The line meets the x-axis where y = 0: mx + b = 0, so x = −b/m. For y = 2x + 1 that is x = −0.5. A flat line y = b with b ≠ 0 never meets the x-axis, and y = 0 is the x-axis itself.
A parabola y = ax² + bx + c becomes the line y = bx + c when a = 0, and at its y-intercept it has slope b: see What a, b and c Do to a Parabola. Shifting and stretching any graph is on Function Transformations. Fitting the best line through noisy data is Linear Regression, and the slope of a curve at a point is the slope of the line it looks like when you zoom in: see Local Linearity.
What the page leaves out
Standard form Ax + By = C, perpendicular slopes (m₁·m₂ = −1), the angle of a line (tan θ = m), solving two linear equations at once, and lines in three dimensions.
See where this page fits on the Algebra & Functions mind map.