The idea: one score, one threshold, two questions
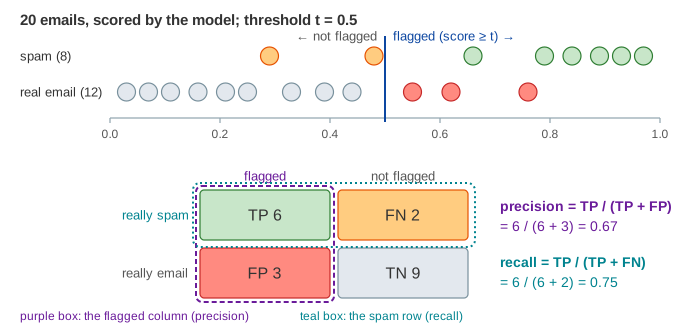
A classifier such as a spam filter does not say "spam" or "not spam" directly. It gives every item a score between 0 and 1, and a threshold t turns the score into a decision: score ≥ t means flagged (predicted positive). Each item then lands in one of four boxes of the confusion matrix: a true positive (TP, spam that was flagged), a false positive (FP, a real email that was flagged), a false negative (FN, spam that got through) or a true negative (TN). Precision and recall are two different questions about the same matrix.
Precision: of what we flagged, how much is right?
Precision = TP / (TP + FP). It only looks at the flagged items. A false positive lowers it; a missed positive does not touch it at all. High precision means "when the model says yes, believe it". It is the number a spam filter cares about: every false positive is a real email lost in the spam folder, maybe a job offer or a bill. (Demo: spam filter, precision first: at t = 0.8 precision is 4 / 4 = 1.00, no real email is lost, and half of the spam still gets through.)
If nothing is flagged, precision is 0 / 0 and undefined; the page shows a dash and plots no point.
Recall: of the real positives, how many did we catch?
Recall = TP / (TP + FN), also called sensitivity or the true positive rate. It only looks at the real positives. A false alarm does not touch it; a miss lowers it. High recall means "if it is there, the model finds it". Cancer screening needs it: a missed tumour can cost a life, while a false alarm costs a follow-up test. (Demo: cancer screening, recall first: lowering t from 0.5 to 0.3 catches the fifth sick patient, recall 0.80 → 1.00, while precision falls 0.50 → 0.38 because 8 healthy patients are now flagged.)
Moving the threshold: the trade-off and the PR curve
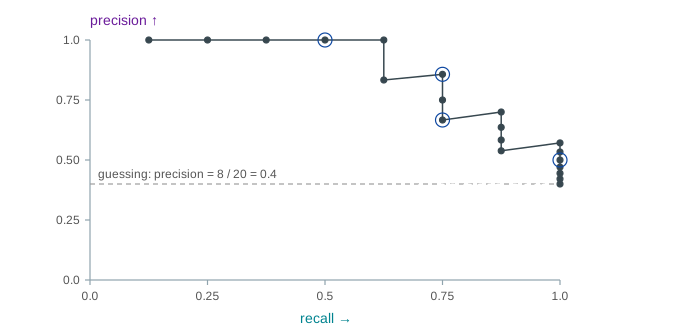
Each Step of the page moves t past one dot, and both lanes update at once. Raising t past a real email removes a false positive: precision goes up and recall cannot change. Raising it past a spam adds a miss: recall goes down. So a higher threshold usually buys precision with recall, and a lower one does the opposite. (Demo: raise the threshold: from t = 0.2 to 0.9, precision 0.50 → 1.00 and recall 1.00 → 0.25.)
Every threshold gives one point (recall, precision). Joining them gives the precision-recall curve. A perfect model reaches the top right corner; a useless one stays near the share of positives, here 8 / 20 = 0.4. (Demo: sweep t visits all 21 thresholds of the spam data.)
Imbalanced data: why accuracy misleads
Accuracy = (TP + TN) / all counts every right answer the same. When positives are rare, the negatives swamp it. In the rare-disease data, 2 people of 30 are sick. A "model" that flags nobody (t = 1.0) is right about all 28 healthy people: accuracy 0.93, recall 0. Lowering t to 0.5 catches both sick people, recall 1.00, but now 11 healthy people are flagged too, so accuracy drops to 0.63 and precision is 2 / 13 = 0.15. The useful model has the worse accuracy. (Demo: rare disease, accuracy misleads) The same effect is behind the base-rate fallacy on the Bayes' theorem page: precision is exactly P(sick | flagged).
F1: one number for both
F1 = 2 · P · R / (P + R), the harmonic mean of precision and recall. Unlike the plain average it is low when either one is low: P = 1.00 with R = 0.25 gives F1 = 0.40, not 0.63. On the spam data the best F1 is 0.80, at t = 0.66 (precision 0.86, recall 0.75). F1 weighs both mistakes the same; when one costs more, choose t for that cost instead.
When to favour which
| task | the costly mistake | favour | threshold |
|---|---|---|---|
| spam filter | FP: a real email hidden | precision | high |
| cancer screening | FN: a tumour missed | recall | low (then a second, precise test) |
| fraud alerts to a small team | FP: wasted investigations | precision | high |
| search, first stage of a recommender | FN: a good result never shown | recall | low, re-rank later |
| both mistakes cost about the same | either | F1 | the best-F1 point |
See also Naive Bayes, a spam filter whose log-probability score could be thresholded this way, Decision Tree Learning, whose leaves give class shares that work as scores, and Bayes' Theorem for the positive medical test.
What the page leaves out
The page uses small hand-made score lists so every count can be checked by eye. It leaves out the ROC curve and its AUC (true positive rate against false positive rate), average precision (the area under the PR curve), the F-beta score that weighs recall β times as much as precision, probability calibration, precision@k for ranked results, averaging over several classes (macro and micro), cost matrices, and picking the threshold on a validation set instead of the test set.