The idea: capital grows until saving = depreciation
The Solow growth model (Robert Solow, 1956) explains the long run: why some countries are richer than others, and why growth from saving alone runs out. Everything is per worker. Each year people save part of their output and that saving becomes new machines, roads and buildings: capital. At the same time some capital wears out, and new workers need capital too. Capital per worker grows while saving is bigger than this loss, and stops at the steady state k*, where the two are equal.
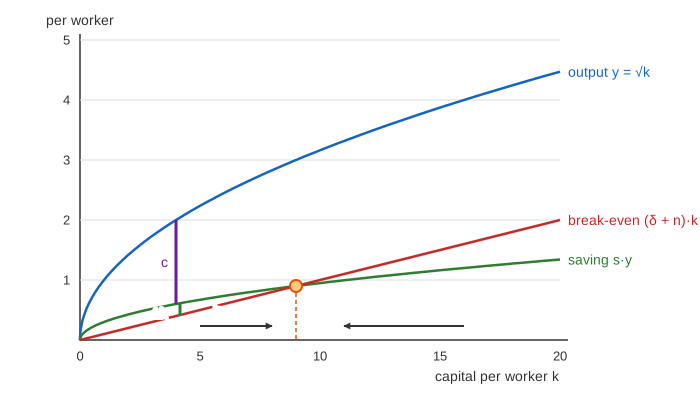
The page uses round numbers: output y = A·√k with A = 1, saving rate s = 30%, depreciation δ = 8% and population growth n = 2%. So the steady state is k* = 9, y* = 3 and consumption c* = 2.10 per worker.
Output and diminishing returns
Output per worker is y = A·kα, a Cobb–Douglas production function. With α = 0.5 it is y = A·√k. Going from k = 1 to 4 raises output from 1 to 2, but going from 4 to 9 only raises it from 2 to 3. Each extra unit of capital adds less than the one before: diminishing returns. This is why the output curve bends over.
The law of motion
Each year capital per worker changes by
Δk = s·y − (δ + n)·k
s·y is investment: the part of output that is saved. (δ + n)·k is break-even investment: δ·k replaces what wears out, and n·k equips the new workers with the same capital as the others. The rest of output, c = (1 − s)·y, is consumption. On the canvas the purple bar is c, the green or red bar is Δk.
Steady state and convergence
At k* saving exactly covers break-even, so Δk = 0: s·A·√k* = (δ + n)·k*, which gives k* = (s·A / (δ + n))². Below k*, Δk is positive; above it, negative. So every economy with the same s, n and A heads to the same k*.
The trip is fast at first and slow at the end. A poor country starting at k = 1 grows 9.5% in its first year but under 1% a year after 40 years (Demo: a poor country catches up). This is conditional convergence: poor countries grow faster than rich ones that share their saving rate and technology. The same happens after a war destroys capital: the economy grows fast back to the old k* (Demo: a war destroys half the capital), much like West Germany and Japan after 1945.
A higher saving rate: a level effect, not lasting growth
Raise s from 30% to 40% and the saving curve moves up. k* rises from 9 to 16 and y* from 3 to 4. On the way, output grows faster than before, but once the economy reaches the new k* growth per worker is back to zero (Demo: saving rises 30% → 40%). Saving more makes a country richer, but cannot make it grow forever, because of diminishing returns.
The golden rule: the saving rate with the most consumption
People care about consumption, not output. With no saving there is no capital and nothing to consume; with 100% saving everything goes to capital and nothing is consumed. In between there is a best saving rate, the golden rule. It is where one more unit of capital adds exactly enough output to cover its own break-even: MPK = δ + n. With Cobb–Douglas output this is s = α, here 50%.
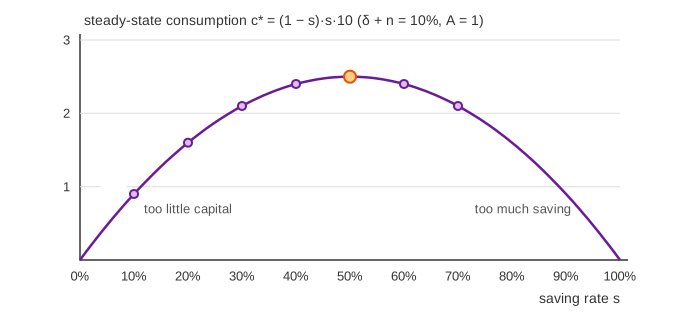
| Saving rate s | k* | y* | c* = (1 − s)·y* |
|---|---|---|---|
| 10% | 1 | 1 | 0.90 |
| 20% | 4 | 2 | 1.60 |
| 30% (start) | 9 | 3 | 2.10 |
| 40% | 16 | 4 | 2.40 |
| 50% (golden rule) | 25 | 5 | 2.50 |
Moving toward the golden rule from below has a cost: on the day the saving rate rises, output is the same, so consumption drops (2.10 → 1.80 when s goes to 40%). It takes about 14 years to climb back above 2.10, and then it ends higher. Watch the purple line in the "Over time" chart (Demo: golden rule, s = 50%).
Population growth
Faster population growth spreads each year's saving over more new workers. The break-even line gets steeper, so k* falls. With n = 4% instead of 2%, δ + n = 12% and k* = 6.25, y* = 2.5 (Demo: faster population growth). Total output still grows at n in every steady state; only output per worker stops growing.
Technology: the only source of lasting growth
A better technology A makes the same capital and workers produce more. With A × 1.2 both curves shift up and k* rises to 12.96, y* to 4.32 (Demo: better technology). A single jump in A, like a single rise in s, only moves the economy to a higher level. Lasting growth in output per worker needs A to keep rising year after year; in the full model output per worker then grows at the rate of technical progress. Solow's model says growth comes from ideas, not from piling up machines.
See also Supply and Demand for one market, and the IS–LM model and the Taylor rule for the short run.
What the page leaves out
The page uses α = 0.5 so the numbers come out round; measured capital shares are nearer 1/3. It uses the simple textbook form Δk = s·y − (δ + n)·k in whole years, with no steady growth in A (no labour-augmenting technical progress), no government, no trade and no money. Saving is a fixed share of output, not chosen by households (the Ramsey model). It leaves out human capital (the Mankiw–Romer–Weil model) and endogenous growth, where technology itself comes from research.