The idea: a ladder of equal factors
This page is about exponential functions in the form
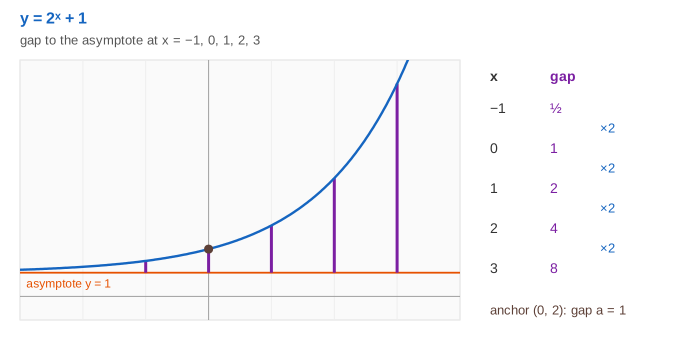
y = a · b^(x − h) + k (b > 0)The graph never reaches the horizontal line y = k, the asymptote. What matters is the gap between the curve and that line: at the anchor x = h the exponent is 0, so the gap is exactly a, and every step of 1 to the right multiplies the gap by b.
So each number has one job:
| coefficient | what it changes |
|---|---|
| a | the gap at the anchor (h, a + k); a < 0 puts the curve below the asymptote |
| b | the factor per step of 1: growth, flat or decay |
| h | slides the anchor sideways, which is also a vertical stretch by b^(−h) |
| k | moves the asymptote y = k and the whole graph with it |
b: growth, flat or decay
From x to x + 1 the gap is multiplied by b, so b alone decides the shape. b must be positive: 0ˣ is 0 and a negative base flips sign at every step.
| b | the graph | per step of 1 | time to double or halve |
|---|---|---|---|
| b > 1 | growth: the gap gets bigger to the right | +(b − 1)·100 %, e.g. 2 → +100 % | doubling time log 2 / log b |
| b = 1 | flat: the line y = a + k | no change | never |
| 0 < b < 1 | decay: the gap shrinks towards 0 | −(1 − b)·100 %, e.g. 0.5 → −50 % | half-life log 2 / |log b| |
b and 1/b are mirror images: 0.5ˣ = 2⁻ˣ is 2ˣ reflected in the y-axis. (Demo 1: b from 3 to 0.3 in steps of 0.1: the curve flattens, is the line y = 1 at b = 1, then turns into decay.)
k: the asymptote
b^(x − h) is always positive and gets as close to 0 as you like, but never reaches it. So a·b^(x − h) + k gets as close to k as you like and never crosses it: y = k is the horizontal asymptote. Changing k lifts the whole graph and the asymptote with it. (Demo 3: k moves the asymptote: at k = −2 the curve 2ˣ − 2 now crosses the x-axis, at x = 1.) A cup of coffee cooling towards room temperature follows such a curve: the asymptote is the room, and the gap halves every fixed number of minutes. (Demo 6: half-life, a cooling cup: y = 3·0.5ˣ + 2 in tens of °C, the gap 6, 3, 1.5, 0.75 …)
a: the gap and the reflection
At x = h the exponent is 0 and b⁰ = 1, so the curve passes through the anchor (h, a + k): a is the gap there. a = 2 doubles every gap; a < 0 reflects the curve in the asymptote, so it lies below y = k and the range is (−∞, k) instead of (k, ∞). a = 0 leaves just the line y = k. (Demo 2: a < 0 reflects below the asymptote: −2ˣ + 2 has range (−∞, 2) and its root at x = 1.)
A root needs a·b^(x − h) = −k, so b^(x − h) = −k/a, which is possible only if −k/a > 0:
x = h + log_b(−k/a) (one root when −k/a > 0, none otherwise)h: a shift is a stretch
For most functions moving the graph sideways and stretching it are different things. Not for exponentials:
a · b^(x − h) = a · b^(−h) · b^x = (a · b^(−h)) · b^x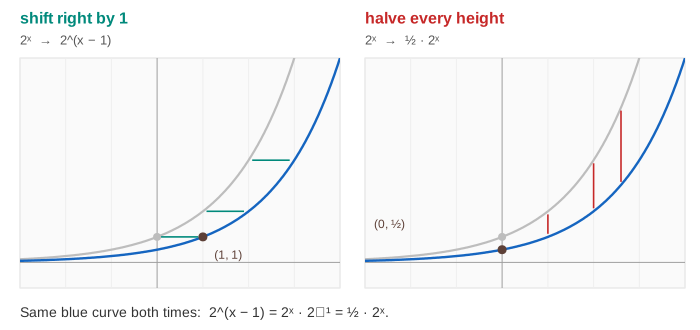
Shifting right by h is the same as multiplying the gap by b^(−h). That is why the "same as a stretch" row of the table never changes the curve, only the way it is written. (Demo 4: a shift is a stretch: 2^(x − 1) is rewritten as ½·2ˣ and the blue curve stays exactly on the grey one.) It also means that the y-intercept a·b^(−h) + k already contains h.
Equal steps, equal factors
For a line, equal steps in x add the same amount; for an exponential they multiply the gap to the asymptote by the same factor:
(y(x + 1) − k) / (y(x) − k) = b for every xThat is how to spot exponential data: subtract the level it settles at, then check that the ratios are equal. (Demo 5: ×2 per step, the ladder: on 2ˣ − 2 the gaps at x = −1 … 3 are ½, 1, 2, 4, 8.)
Base e
Every positive b is a power of e: b = e^r with r = ln b. So the same curve can be written a·e^(r(x − h)) + k, with growth for r > 0 and decay for r < 0. 2ˣ is e^(0.693x), 0.5ˣ is e^(−0.693x). Where e comes from, doubling and half-life stories, logarithms and log axes are on Exponentials and Logarithms.
What the page leaves out
Solving exponential equations in general, logistic (S-shaped) growth, fitting a curve to data, compound interest, and graphs that need a bigger window than x ∈ [−6, 6], y ∈ [−6, 8]. The same moves for any function (shift, stretch, reflect) are on Function Transformations; another graph with a horizontal or slant asymptote is on Rational Functions: What a, b, c, e, f Do.