The idea: one request, one trace, many spans
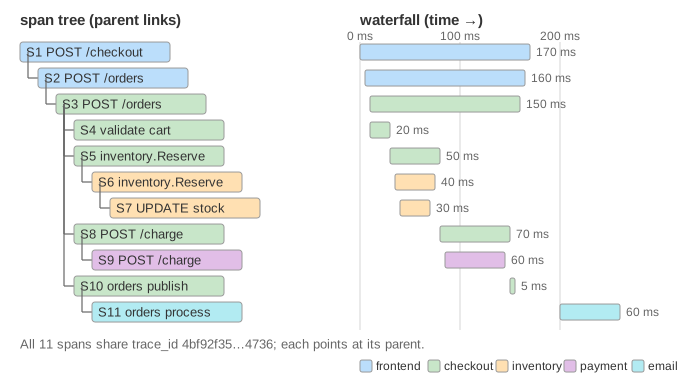
A request to a web shop rarely stays in one program. Here POST /checkout goes from frontend to checkout, which calls inventory (and its database), calls payment and leaves a message for email. When the request is slow or fails, logs from five services do not say which step was to blame. Distributed tracing records the whole path as one trace.
A trace is a tree of spans. A span is one unit of work: an HTTP request handled, a call made, a SQL query, a message processed. Every span of the trace carries the same trace_id, and each span knows its parent. OpenTelemetry (OTel) is the open standard for producing them: an SDK in every service, a wire format (OTLP) and a Collector that forwards them to a backend such as Jaeger or Grafana Tempo.
What is in a span
| Field | Example on this page |
|---|---|
trace_id (16 bytes) | 4bf92f3577b34da6a3ce929d0e0e4736, shared by all 11 spans |
span_id (8 bytes) | 00f067aa0ba902b7 for the root span S1 |
parent_span_id | S3's parent is S2; the root has none |
| name, kind | POST /orders, SERVER |
| start and end time | S3 runs from +10 ms to +160 ms |
| attributes | http.request.method = POST, db.system.name = postgresql |
| events | an exception event with exception.type and exception.message |
| status | UNSET normally, ERROR when the work failed |
| resource | service.name = checkout, the same for every span of a process |
Attribute names follow the OTel semantic conventions, so every backend knows that http.response.status_code means the same thing in Java, Go and Python services. Pick a span in the detail: menu to see its fields on the canvas.
Span kinds
| Kind | Meaning | On the page |
|---|---|---|
SERVER | handles an incoming synchronous call | S1, S3, S6, S9 |
CLIENT | makes an outgoing call and waits for the answer | S2, S5, S7, S8 |
INTERNAL | work inside one process | S4 validate cart |
PRODUCER | sends a message that is handled later | S10 orders publish |
CONSUMER | handles that message | S11 orders process |
One call between two services is two spans: the caller's CLIENT span and the callee's SERVER span. The client span is always a little longer; the difference is network time, connection setup and queuing. A call to a database has only the client span, because the database runs no SDK. A CONSUMER span may end long after the request was answered: on the page S11 runs after the browser already has its 200 OK.
Context propagation and traceparent
Inside one process the SDK keeps a current context: the active span. A new span started there gets the active span as its parent. Between processes the context has to travel with the request. The caller injects it into the request headers and the callee extracts it. The W3C Trace Context standard defines the header:
traceparent: 00-4bf92f3577b34da6a3ce929d0e0e4736-00f067aa0ba902b7-01
             version  trace-id (16 bytes)          parent-id (8 bytes)  flags
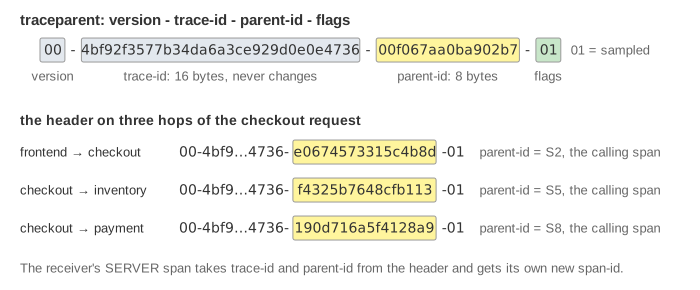
The parent-id is the id of the calling span (S2 when frontend calls checkout), so the server span can point at it. The flags byte has one bit in use, sampled. A second header, tracestate, carries vendor-specific data, and baggage carries your own key-value pairs (a tenant id, say) along the same path. Messages carry the same header in their message headers, which is how S11 finds S10.
If one hop does not extract the header (an uninstrumented framework, a proxy that strips unknown headers, a thread pool that loses the context), the next span finds no parent and starts a new trace. The backend then shows two partial traces instead of one (Demo 4: broken propagation).
From the SDK to the backend
Spans are not sent while they run. When a span ends, the SDK's BatchSpanProcessor puts it in a queue. A background worker exports the queue when it holds maxExportBatchSize spans (default 512) or every scheduledDelayMillis (default 5000 ms); the page uses 4 spans and 100 ms so you can watch it. If the queue (maxQueueSize, default 2048) is full, new spans are dropped.
The export is an OTLP ExportTraceServiceRequest over gRPC (port 4317) or HTTP (4318). Usually it goes to an OpenTelemetry Collector: a pipeline of receivers (here otlp), processors (batch, tail_sampling, attribute filters) and exporters (to Jaeger, Tempo, a vendor). Apps then need to know only one address, and the Collector can retry, batch and filter for them.
Because a span is exported when it ends, a child usually reaches the backend before its parent: checkout's S4 and S5 arrive while S3 is still running (Demo 1, rows marked ?). The backend stores spans by trace_id and rebuilds the tree from the parent ids whenever you open the trace.
Sampling: head vs tail
Tracing every request of a busy service costs CPU, network and storage. Sampling keeps only some traces. The decision must be the same for every span of a trace, or you get traces with holes.
| Head sampling | Tail sampling | |
|---|---|---|
| Where | in the SDK of the root service | in the Collector |
| When | when the root span starts | after the whole trace has arrived (decision_wait, default 30 s) |
| How it spreads | the sampled flag in traceparent; downstream services use ParentBased and follow it | every span is exported; the Collector drops whole traces |
| Can keep "all errors, all slow ones" | no: nothing is known yet at the root | yes: policies such as status_code and latency |
| Cost | cheap: unsampled spans are never recorded | every span crosses the network; the Collector holds traces in memory, and all spans of a trace must reach the same Collector |
TraceIdRatioBased(0.25) looks only at the random bits of the trace id: the page compares the last 14 hex digits (56 bits) with the threshold c0000000000000 = 0.75 · 256 and keeps the trace when they are at least that big. Any service would compute the same answer from the same id. Older SDKs used a slightly different rule on the low 64 bits; the idea is the same.
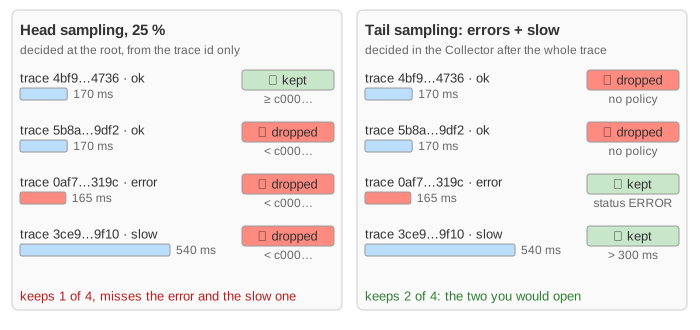
Demo 5 sends four requests with head sampling: one is kept, the other three still carry traceparent …-00 on every hop but record nothing. Demo 6 sends four with tail sampling: all are exported, the Collector keeps the one with an error and the slow one.
Reading a waterfall
- Where did it fail? Find the deepest span with status
ERROR; itsexceptionevent says why. Its ancestors are usually red too, because each caller records the failure it received (Demo 2: payment fails). - Where did the time go? Follow the critical path, the chain of spans the request had to wait for. Start at the end of a span and walk back: take the child that ends last, then the child that ended before that one started, and so on; go down into the longest of them and repeat. In Demo 3 S3's children run one after another and S5 takes 420 of its 520 ms; inside S5 it is S6, and inside S6 the 400 ms
UPDATES7. - Gaps between a client span and its server span are network or queue time. A long gap before S11 is a consumer that is behind.
Traces, metrics and logs
Traces are one of three signals. Write the trace_id and span_id into every log line and you can jump from a log to its trace. Metrics can carry exemplars: a trace id attached to a latency histogram bucket, so a spike on a dashboard links to a real slow request.
See also gRPC (the calls checkout makes), Kafka (the orders topic), API Gateway and Circuit Breaker (what to do with the slow call the trace found).
See also Monolith vs Microservices: why one checkout becomes four network calls in the first place.
What the page leaves out
Real services are usually traced by auto-instrumentation (a Java agent, Python or Node packages) that creates the HTTP, gRPC, database and Kafka spans without code changes; you add your own spans for business steps. The page leaves out span links (a batch consumer links to many producer spans instead of having one parent), tracestate and baggage contents, clock skew between machines, the metrics and logs SDKs, Collector load balancing for tail sampling, span limits on attributes and events, and the B3 and Jaeger header formats that came before W3C Trace Context.