The idea: count boxes, halve them, count again
The Koch curve is said to have dimension about 1.26. That number is not a figure of speech: you can measure it. Lay a grid of square boxes of side s over the shape and count N(s), the boxes the shape passes through. Then halve s and count again. The way N grows when the boxes shrink is the dimension.
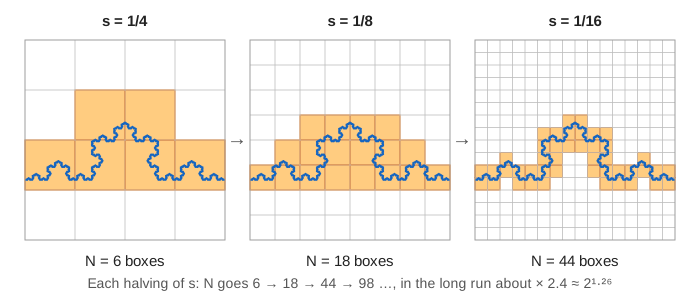
On the canvas the shape sits in a unit square. Size k means 2ᵏ × 2ᵏ boxes of side s = 1/2ᵏ, from one box (k = 0) down to boxes of side 1/128 (k = 7). Halve box size splits every box into 4 in four steps: the boxes split, an orange sweep counts the new boxes row by row, the point (k, log₂ N) appears, and it flies to the plot. Count all sizes does every halving left, one step each.
Why the slope is the dimension
Halve the boxes along a straight line and you need 2× as many. Halve them over a filled square and you need 4× = 2² as many; inside a cube it would be 8× = 2³. The power of 2 is the dimension. So for a shape of dimension D, each halving multiplies N by 2ᴰ:
N(s) ≈ C · (1/s)ᴰ log₂ N ≈ D · log₂(1/s) + log₂ C D = slopeWith s = 1/2ᵏ, log₂(1/s) is just k. Plot log₂ N against k and the points lie near a straight line; its slope is the box-counting dimension. One step right on the plot is one halving, so the rise of one step is log₂ of how much N grew.
| shape | N grows per halving | dimension D |
|---|---|---|
| circle (a smooth curve) | about × 2 | 1 |
| Koch curve | about × 2.4 | log₂ 2.4 ≈ log 4 / log 3 ≈ 1.262 |
| Sierpinski triangle | exactly × 3 | log₂ 3 ≈ 1.585 |
| filled square | exactly × 4 | 2 |
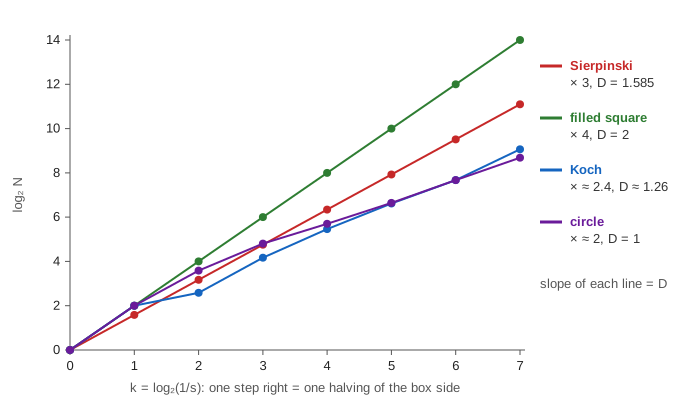
A shape with dimension 1.26 needs more boxes than any smooth curve as the boxes shrink, but far fewer than an area. That is what the number measures: how quickly the shape fills up space as you look closer. (Demo: a circle is smooth: D = 1, Demo: a filled square: N × 4, D = 2.)
The Koch curve: single halvings wobble, the fit does not
The Koch curve is built from thirds, and the grid is built from halves, so they never line up. Some halvings catch many new boxes, some few:
| k | box side s | boxes N | N grew × | log₂(×) |
|---|---|---|---|---|
| 2 | 1/4 | 6 | 1.50 | 0.585 |
| 3 | 1/8 | 18 | 3.00 | 1.585 |
| 4 | 1/16 | 44 | 2.44 | 1.290 |
| 5 | 1/32 | 98 | 2.23 | 1.155 |
| 6 | 1/64 | 204 | 2.08 | 1.058 |
| 7 | 1/128 | 536 | 2.63 | 1.394 |
No single row says 1.26. The cure is the same as in any measurement: use many sizes and fit one straight line through all the points (least squares). Through k = 2 … 7 the fitted slope is 1.259, against the exact log 4 / log 3 = 1.262. The page leaves out k = 0 and 1: boxes as big as the shape say little, since almost any shape touches all 1 and all 4 of them. (Demo: Koch curve, box sides 1 → 1/128, Demo: one halving up close (Koch, 1/8 → 1/16).)
Box counting and the similarity dimension
For a shape made of N copies of itself, each scaled by r, the similarity dimension is log N / log(1/r): the Koch curve is 4 copies at 1/3, so log 4 / log 3; the Sierpinski triangle is 3 copies at 1/2, so log 3 / log 2. (Both are on Fractal Curves and the Chaos Game.) Box counting gives the same number for such shapes, and for the right-angled Sierpinski triangle the grid lines up perfectly with the copies: every halving multiplies N by exactly 3 (Demo: Sierpinski triangle: N × 3 every time).
The point of box counting is that it needs no copies at all. It works on any set you can draw or measure: the graph of the Weierstrass function, a cloud of points from the Barnsley fern, the edge of the Mandelbrot set, a scanned coastline.
Coastlines and real data
Lewis Fry Richardson measured coastlines with rulers of different lengths and found that the length kept growing as the ruler shrank. Benoit Mandelbrot read his numbers as a dimension: the west coast of Britain comes out near 1.25, close to the Koch curve; the smooth border of South Africa near 1.02. With real data the line is only straight over a range of sizes: boxes larger than the map or smaller than its pixels tell nothing, so the fit uses the middle range, as the page does with k = 2 … 7.
What the page leaves out
Boxes smaller than 1/128 (a few pixels on the canvas), grids shifted or rotated to lower the count (the formal definition takes the fewest boxes), the Hausdorff dimension, which can differ from the box dimension on strange sets such as the rational numbers, the formal limit (lim log N / log(1/s) and upper and lower box dimensions), and dimensions of sets in 3-D. One counting rule is fixed without discussion: a box counts when the shape passes through its inside, not when it only touches an edge; another rule changes N a little but never D.
See where this page fits on the Fractals mind map.